
How to set up your Market intelligence
MyTelescope turns search into forecast-ready demand—83% correlation to market share, sales and revenue. Privacy-safe. Warehouse-ready. Start in minutes.
How to set up your Market Intelligence
1 Set up your category
Set geo + language (keep consistent).
Create category keywords (synonyms + misspellings); add excludes.
Quick scan top queries; remove noise.
2 Competitors vs You
List your brand and each competitor with official names, nicknames, and abbreviations (e.g., “Coca-Cola,” “Coke”)
Use the same geography, language, and date range for every brand.
Track Share of Search (your share of all brand searches), month-over-month change, and seasonality.
3 Set up your Main products and offerings
vs your competition
List your key products and the closest competitor equivalents.
Build product keyword sets: model names, shorthand, attributes. Exclude jobs and support.
Link products to parent brands for clean roll-ups.
Track Product Share of Search, 3-month momentum, and top theme drivers.
4 Final checks
Clear names and notes on includes/excludes.
Coverage near 90% of known queries, minimal noise.
Consistent settings across all charts. Privacy-safe, behavior-based data.Set up your Category
Business impact & data deliverables
78%
Sheraton correlation to revenue
85%
CPG correlation to market share
73%
Wine and Spirits correlation to revenue
90%
Automotive correlation to Market share
Why teams use it
See shifts earlier—lead time is category-dependent (validated in your backtest).
Make calls with proof from real searches and questions—because nobody lies to their search bar (or their chatbot).
Plug in fast with ready APIs and flat files—no rebuild of your models.
What you get (monthly feed)
Real-interest index by market • brand • model/attribute
Month-over-month change and simple curve tag (seasonal / spike / step-up / decay)
Coverage across your key markets and segments
Lineage & versioning for audit and governance
ROI (examples):
Reduce stockouts: EV trims reallocated to “fast-charging” hotspots → stockouts −2–4 pp, sell-through ↑.
Prove marketing → revenue: Geo-split test shows demand index +15–20% → revenue +3–7%, ROAS +10–20%.
Lower safety stock & markdowns: Appliances shift based on rising search → safety stock −5–10% (same service level), markdowns −4–8%.
Illustrative only; impact and lead time are category-dependent. Privacy-safe
What you get (monthly feed)
Real-interest index by market • brand • model/attribute
Month-over-month change and simple curve tag (seasonal / spike / step-up / decay)
Coverage across your key markets and segments
Lineage & versioning for audit and governance
Start yourself (no forms, no wait)
Sign up → instant 30-day free trial
Pick your category & markets (e.g., Auto • US/UK/SE/DE/IN)
Pull the feed into your warehouse or notebook
Forecasting / FP&A: Cut error and detect demand shifts earlier (lead time is category-dependent).
Supply Chain / S&OP: Re-plan mix, allocation, and replenishment using early demand signals to reduce stockouts and overstock; move inventory to hot markets/models sooner.
Category / Merchandising: Set the right model/attribute mix by market; adjust purchase orders and transfers ahead of the curve.
Marketing: Time media and creative to rising demand; lead with proofs.
Examples and use cases
for Use case i.e Demand forecasting

What Is Brand Marketing?
Brand marketing connects your brand to real demand by building memory associations people recall when solving problems. In the AI era, being remembered matters more than being clicked.

Consumer insights

Build the right product for the new market.
Monthly demand data helped the team pivot and launch a product that fit the new market. They saved time collecting data and doubled marketing effectiveness.
Stock what sells, when it sells.
Monthly demand data from what people search and say helped a team stock what sells, stay in stock, double marketing effectiveness, and avoid price promotions.

True competitors, city by city
How a corporate team saw who in-market car buyers actually compare - and doubled marketing effectiveness.
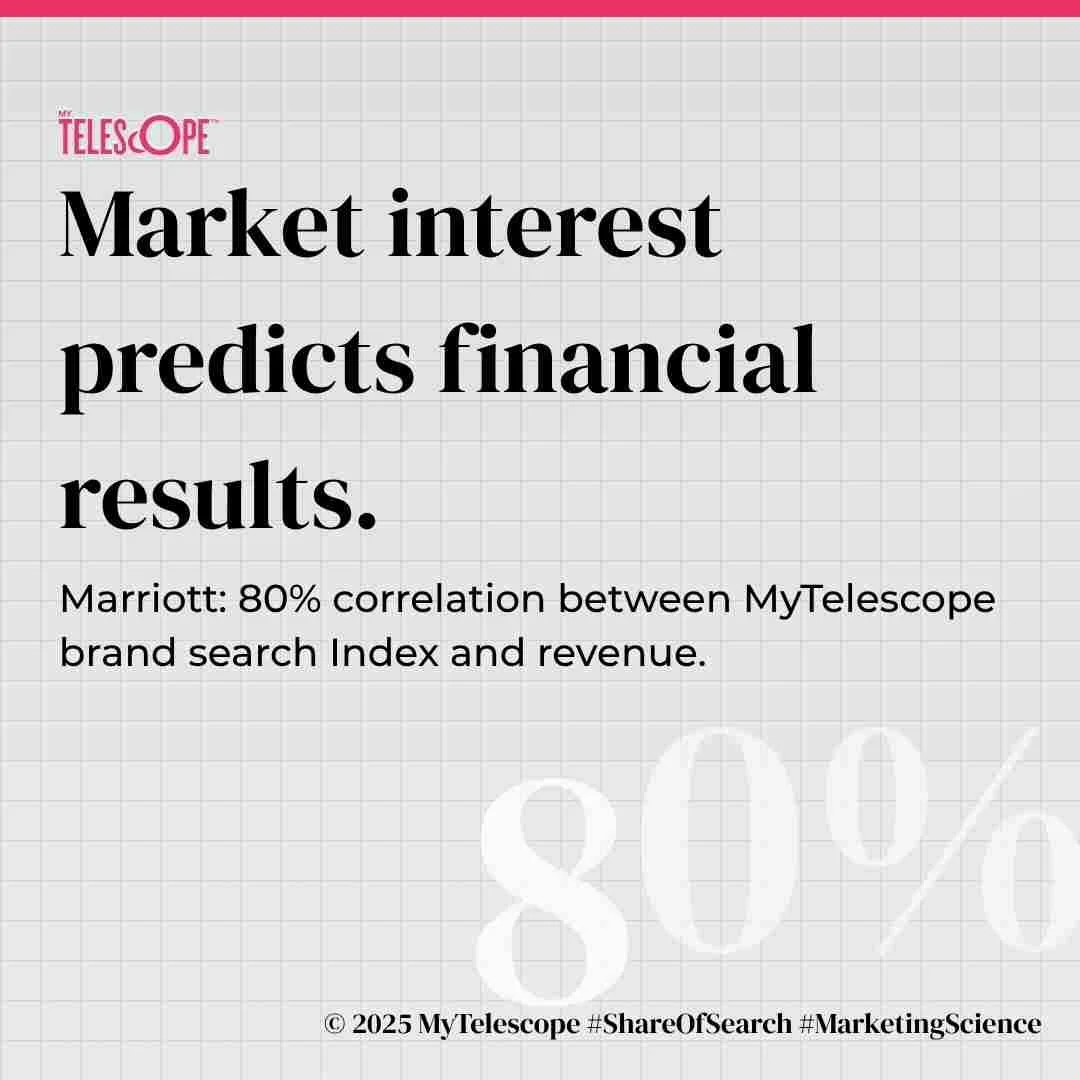
Know What People Are Interested In. Not What They Say
Surveys capture what people say. MyTelescope is an AI platform that measures market interest from aggregated, privacy-safe behavioral signals. With validated correlations to revenue (e.g., Marriott r=0.80), you can forecast demand, plan spend, and defend budgets with evidence.